We dream the internet to be a great public meeting place where all the world’s cultures interact and learn from one another, but it is far less than that. We are separated from ourselves by language, culture and the normal tendency to seek out only what we already know. In reality the net is cliquish and insular. We each live in our own little corner, only dimly aware of the world of information just outside. In this the internet is no different from normal human life, where most people still die within a few kilometers of their birthplace. Nonetheless, we all know that there is something else out there: we have maps of the world. We do not have maps of the web.
I have met people who have never seen a world map. I once had a conversation with herders in the south Sahara who asked me if Canada was in Europe. As we talked I realized that the patriarch of the settlement couldn’t name more than half a dozen countries, and had no idea how long it might take to get to any of the ones he did know. He simply had no notion of how big the planet was. And to him, the world really is small: he lives in the desert, occasionally catches a ride to town for supplies, and will never leave the country in which he was born.
Online, we are all that man. Even the most global and sophisticated among us does not know the true scope of our informational world. Statistics on the “size” of the web are surprisingly hard to come by and even harder to grasp; learning that there are a trillion unique URLs is like being told that the land area of the Earth is 148 million square kilometers. We really have no idea what we’re missing, no visceral experience that teaches our ignorance.
We can remedy this.
First, language. When asked about the Chinese internet, the best most Westerners can manage is “here there be dragons.” Although machine translation is coming along and Google now includes it standard, we do not yet appreciate that the web in other languages could be important. In fact, unless you have twiddled your preferences, the multi-lingual web will not normally appear in your search results. There must have been a point in history when European maps did not show China, and Chinese maps did not show Europe; this is where we live today. The result is a strange sort of online invisibility between the major cultures of the world.
Another kind of invisibility results from gaps in media coverage. Even without the effects of censorship (of both press and internet varieties) there is the question of what counts as news; a famous example is the paucity of world events coverage in the American media. Although blogs can fill the reporting gap, a terrific story means nothing if no one knows where to read it.
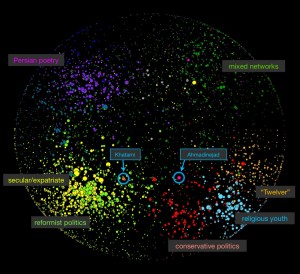
Within the limitations of what we can view there are the limits of what we do view. A map of the Iranian blogosphere shows one cluster of visited of sites frequented by reformists and expats, and another for by conservatives and religious youth. In the United States, Amazon book sales data shows that liberals and conservatives don’t read each other’s books. Ideology aside, each person has particular interests; not everyone can be concerned with colony collapse disorder, Polish cinema, or the oil pipelines of Turkmenistan.
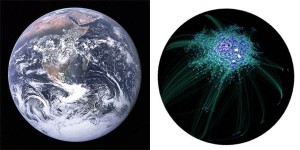
It’s not that everyone should care about everything; that’s ridiculous and impossible. I am also not concerned about finding things specifically sought; we have search engines for that. Rather, the point of a map is to know that something is there at all. I want school-children to see the web from space. I want maps of the web and its various resources, online, up to date, for everyone.
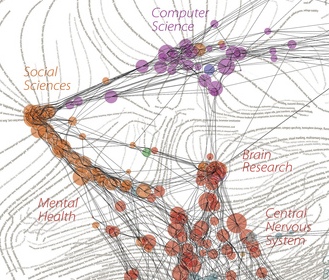
We understand, in a general sense, how to make such maps. There have already been a number of large-scale maps of online information, such as the blogosphere visualizations of Matthew Hurst. In his images, each dot is a blog and each arc represents a hyperlink. Automatic layout minimizes the distance between clusters of interlinked blogs, translating nearness on the web into nearness on the map. Looking at these incredibly detailed images, where each tiny dot is a blog, I am overwhelmed by how big just this one corner of the internet can be, and how little of it I can ever perceive. I am also deeply impressed by the Places and Spaces charts of science and other fields, and the phenomenal Scientific Method: Relationships Among Scientific Paradigms. Browsing these maps, I am struck everywhere by the existence large-scale patterns, the continents of a geography I didn’t know existed.
But these views are partial, specialized, and require enormous one-time resources to produce. They are curiosities, not navigation instruments. Until such maps exist in real-time in every browser they are just the toys of academics.
Imagine, then, a online newsreader (RSS reader, feed reader) with a map. I imagine all the world’s feeds drawn out in multiple colors, perhaps mapped out on a sphere. If each of your subscribed feeds was marked with a colored dot on the surface of this abstract Earth — which would include news and blogs from other cultures, ideologies, and languages — then it would be possible to see at a glance just where you stand in information space, and how wide or narrow your perspective. We would finally be able to put a finger down and say “you are here” in the world of what could be learned from the web.
The point is to engage curiosity, to encourage ourselves to leave the house online. In “Intelligent News Agents, With Real New” I envisioned a system that monitors what you read and automatically suggests topics that are as “different” as possible from your usual fare. This is a well-intended attempt to help you escape from the informational ghetto you grew up in, but I now think that such a system would be an utter failure. No one likes to be told what to read. Anyway, how is a programer to to decide what we “should” be viewing? Instead of trying to direct attention, let’s just make people aware of the geography.
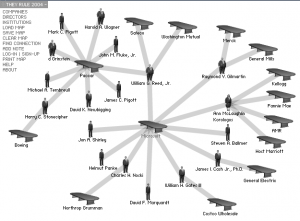
There are many things that could be mapped. RSS feeds now include all the major news media, plus blogs, so they are an obvious place to start. A larger whole-web map seems essential for its sheer scope, and another “you are here” moment might arise from plotting personal browser history against such a map. All sorts of global patterns might also become apparent if we visually coded sites by language or topic, as I suggested in “How Many World Wide Webs are There?” Maps of academic publications or books, such as the maps of science discussed above, would reveal more slowly changing patterns in the world’s knowledge. Maps of corporate or political connections – something like a whole-world social network, or akin to the remarkable corporation browser of theyrule.net – would be difficult to generate, requiring considerable data-mining of public information, but could provide an up-to-date snapshot of global economic and power structures.
In all cases, our maps must be drawn very carefully, especially with regard to what counts as a link, because a map of something which is not fundamentally spatial can only be a metaphor. When well chosen, metaphors are powerful because they allow reasoning about one domain through the more familiar concepts of another; when poorly chosen, metaphors are unclear or deceptive. A map also engages our spatial reasoning faculties, the ability to grasp shape and structure at a glance. When we draw maps of information, we are seeking a visual representation of abstract properties such the number of connecting links between blogs, co-authorship of books, or similarity of word vectors. This can be done well or poorly, as Edward Tufte has spent his life demonstrating.
Along this line, I feel that our web maps should be spheres and not planes. Not only does a sphere suggest the Earth, but there is no center on a sphere, no privileged continent. A sphere also provides the concept of an antipode, the point farthest away from wherever you stand. It is good to wonder what is on the other side of the world.
The maps I want are also live. They are not snapshots, nothing like the “blogosphere as recorded by web crawl in August 2007” that we see in captions today. Instead, they must be continually updated, just as our search engines continually re-crawl the web. Our internet also needs history, as The Internet Archive and Google Trends know. I want a time slider on every map, a little widget that lets one scroll back and forth through history and actually watch new blogs rise to prominence, or see the polarization that occurred after 9/11. I want to see the continental drift.
Technologically, none of this is especially difficult, at least not in concept. A whole-web map of all accessible pages does require work with very large datasets, perhaps hundreds of terrabytes, but there are many corporations that know how to do this, often under the label of cloud computing. It also requires whole-web indices, and this is a trickier problem because only the search engine companies currently have the required infrastructure (and are willing to pay for it). The sorts of maps I propose are fundamentally expensive to maintain, which is probably part of why they don’t already exist. This implies centralization, and Google could certainly do the job — if they wanted to, or if they were willing to let others access their data. (Update: more on the economics of web indices.) But details follow need; like Stewart Brand, maybe we first need to want to see the whole world from space.
I live with very idealistic hopes. I believe that being aware of our world truly enables us live better at all scales, from where to brunch to national policy options for desertification. I also believe that communication can reduce bigotry, intolerance, and ultimately conflict, at least if the next generation is exposed young enough. But information that we do not even know exists cannot help us, and the ability to communicate with someone anywhere in the world means nothing if we are never tempted to do it. It is not our fault that we all live in informational ghettoes, but we need to make it obvious that we do.


http://www.linkfluence.net/